Large Image Frame Selector in Jupyter
The large_image library has some convenience features for use in Jupyter Notebooks and Jupyter Lab. The same widgets that can allow compositing frames together in Girder and HistomicsUI can also be used in Jupyter.
Installation
The large_image library has a variety of tile sources to support a wide range of file formats. The example used in this notebook can just be pip installed. We also install ipyleafleft to allow interactivity with the images.
[1]:
!pip install large_image[tiff] 'ipyleaflet>=0.19' ipyvue --find-links=https://girder.github.io/large_image_wheels
Get a Sample File
Now we get a file to show off some of the capabilities. The sample file is an extract from a much larger file but is sufficient for demonstration purposes.
[2]:
# Get a file so we can use it locally
!curl -L -C - -o wd-extract.jpeg.tiff https://data.kitware.com/api/v1/file/hashsum/sha512/ab0e68399f924484b96e2268e3ac277875b10619a673dcf3951380a5e5f0c9bb2b37139a8c522dacc0f40036fcb438a30143b69874454299af64ebb8062b272a/download
** Resuming transfer from byte position 51446408
  % Total    % Received % Xferd  Average Speed   Time    Time     Time  Current
                                 Dload  Upload   Total   Spent    Left  Speed
  0 49.0M    0     0    0     0      0      0 --:--:-- --:--:-- --:--:--     0
Load the file in python
When we open a file, it just reads the metadata. Actual pixel data is read as needed.
[3]:
import large_image
source = large_image.open('wd-extract.jpeg.tiff')
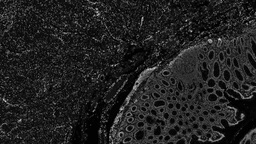
# The thumbnail method returns a tuple with an image or numpy array and a mime type
source.getThumbnail()[0]
[3]:
Show the Image Interactively
If ipyleafleft is available, you can zoom in on the image. Since this is a multi-frame image (there are 24 image channels), you also get controls to look at different frames.
Try these:
Switch the Image Control Mode to “Channel Compositing”.
Switch the Image Control Mode to “Axis” and click “Max Merge”.
On Channel Compositing, turn off all channels except “Antigen Ki67” and click “Auto Range”
[4]:
# Just end your cell on the source variable, and an interactive image will appear
source
[ ]: